
The following figures show the sequence motif of the DNA and their nucleotide sequences. The small letters of a, b, c, … mean each motif, and letters with prime mean complementary sequences.
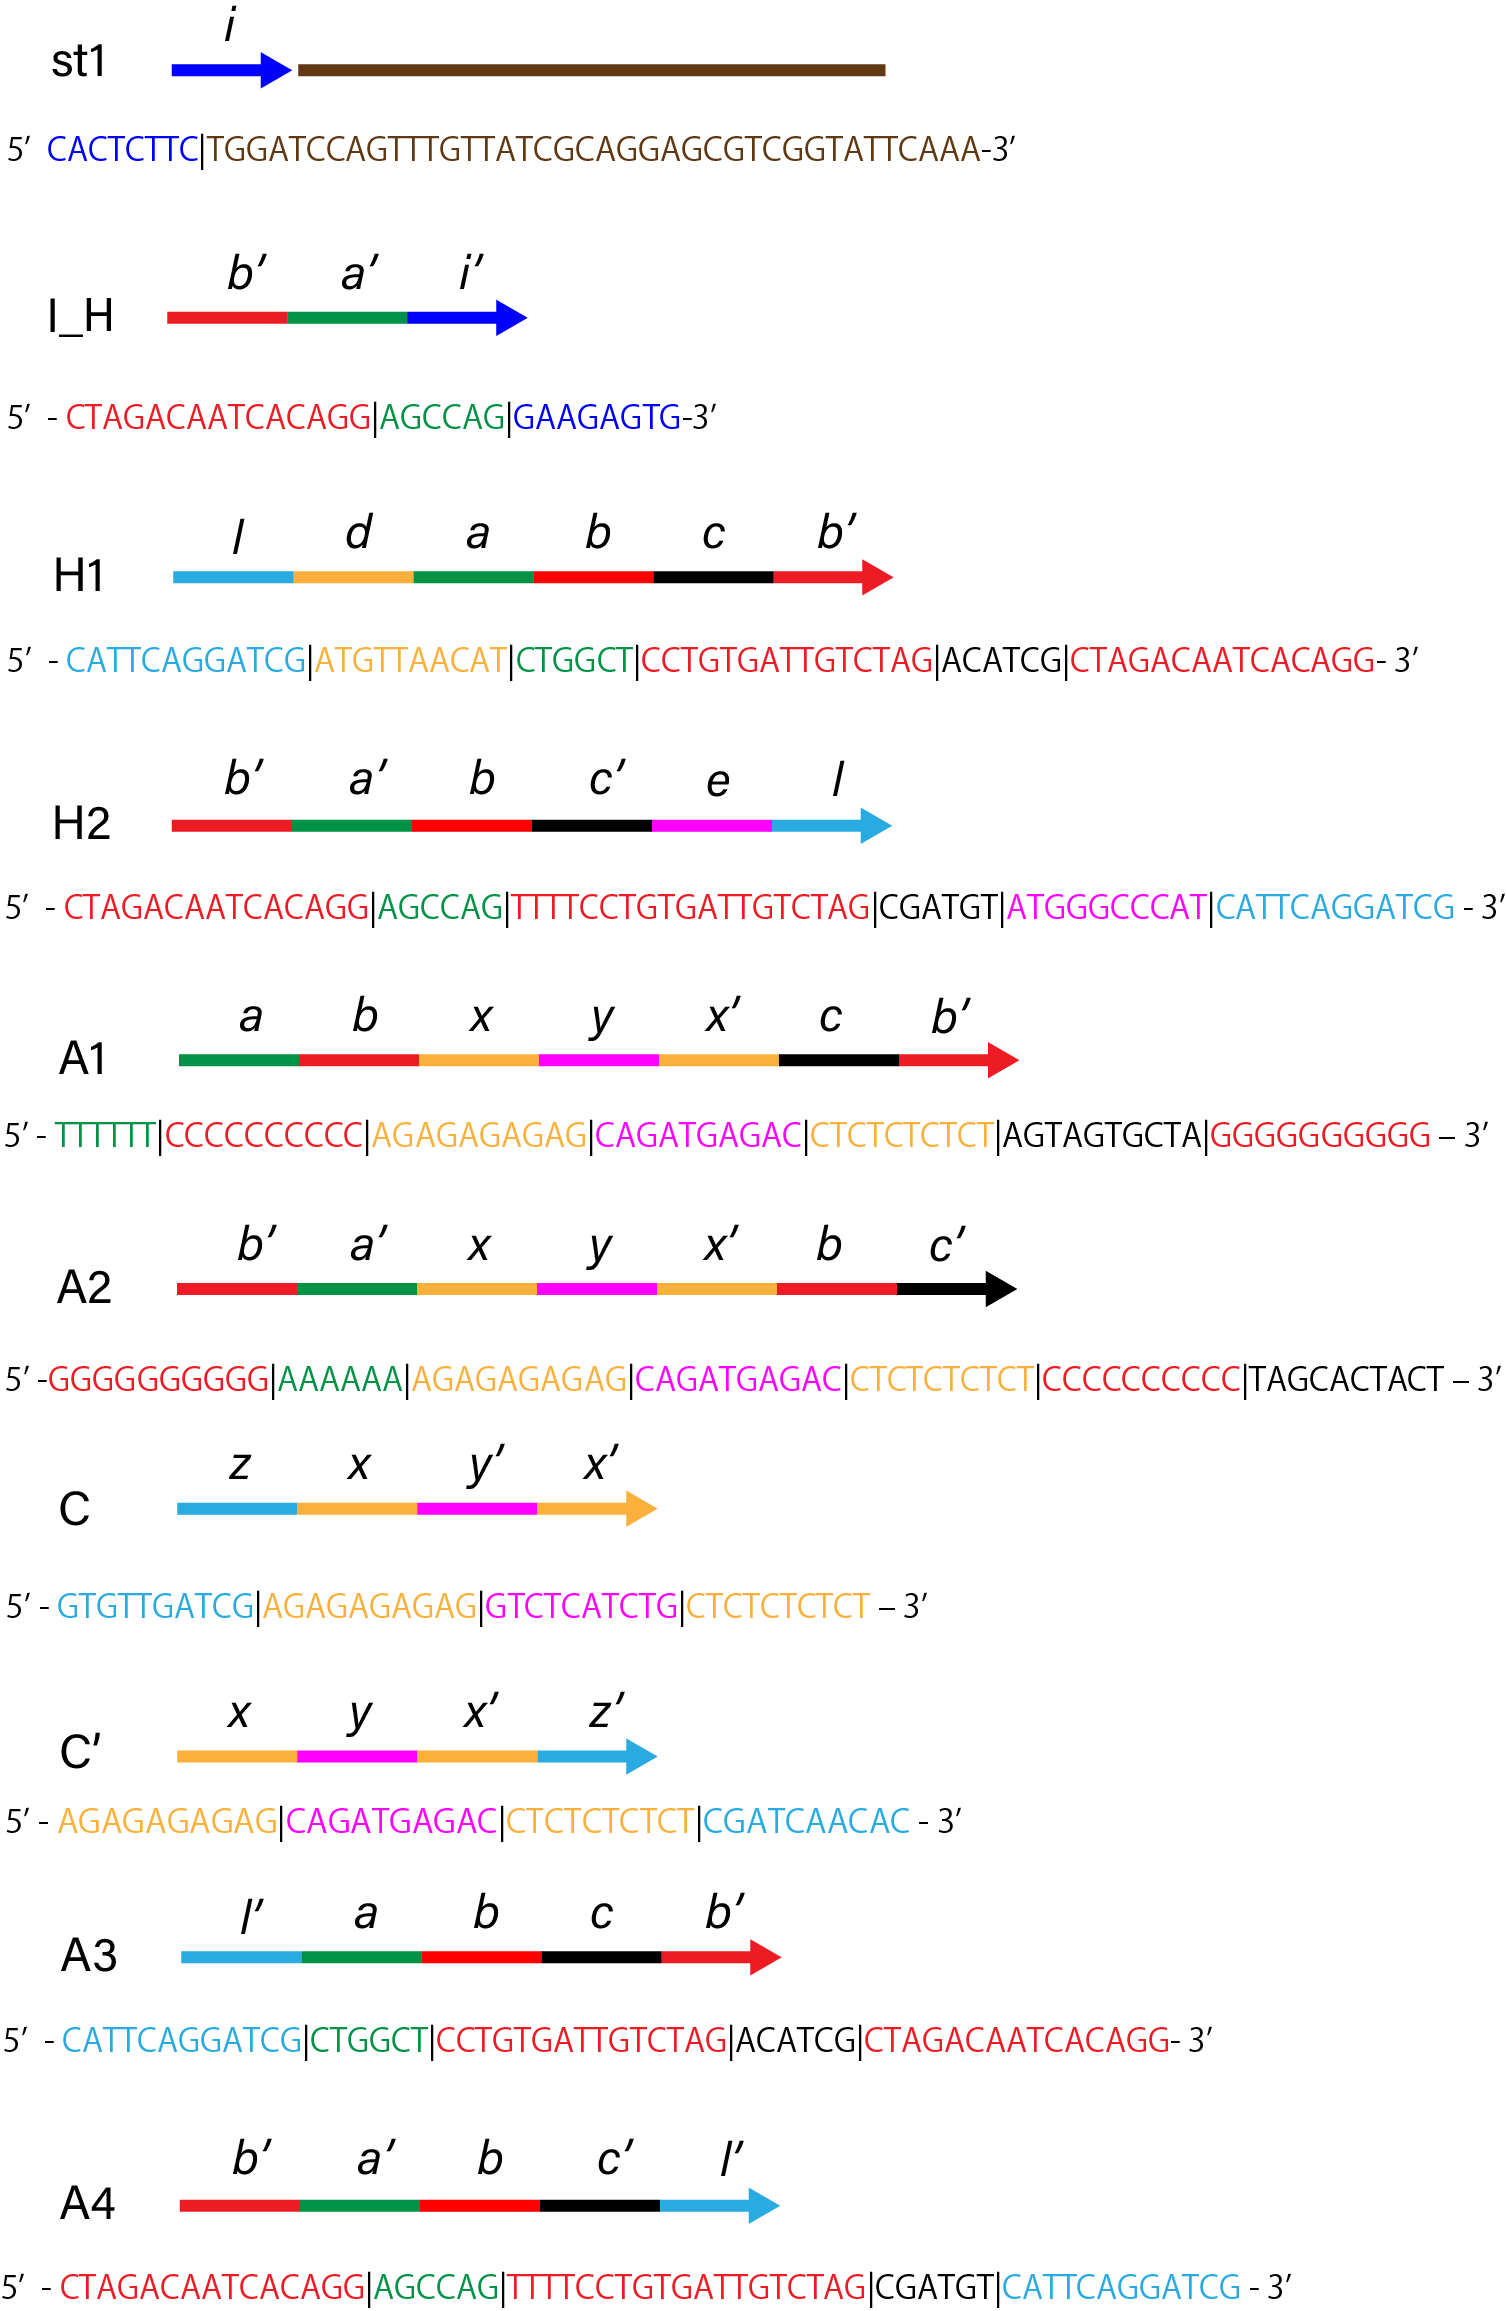
Using the NUPACK(http://www.nupack.org/), the software for the analysis and the design of sequences, the states of the combinations of the above sequences was calculated.
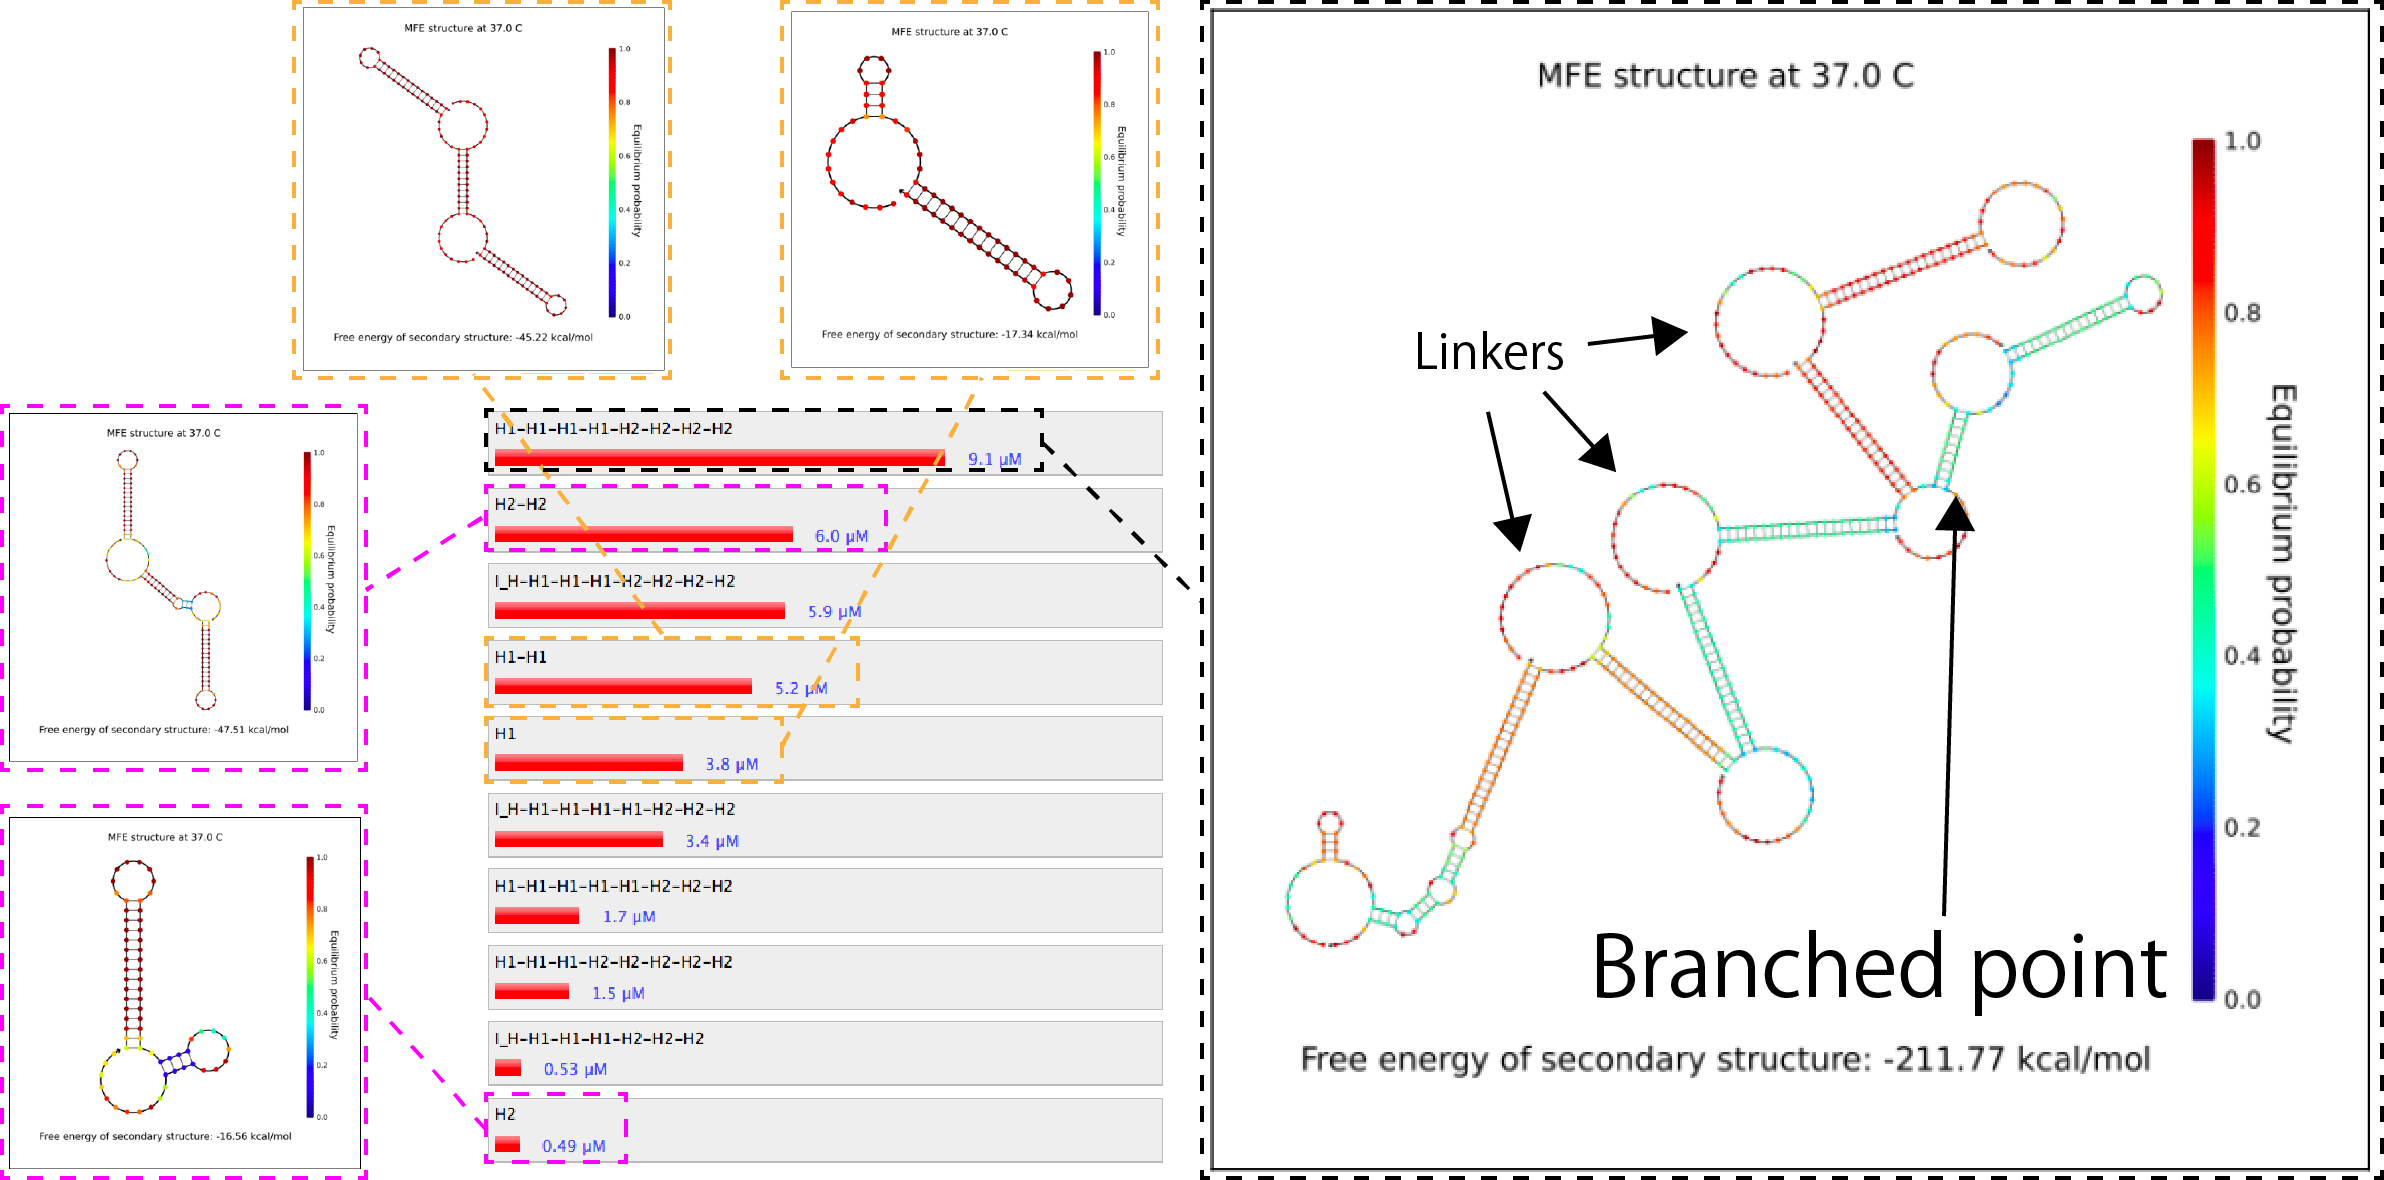
Figure 1. Similation results of the combination of H1, H2 and I_H.
link to nupack
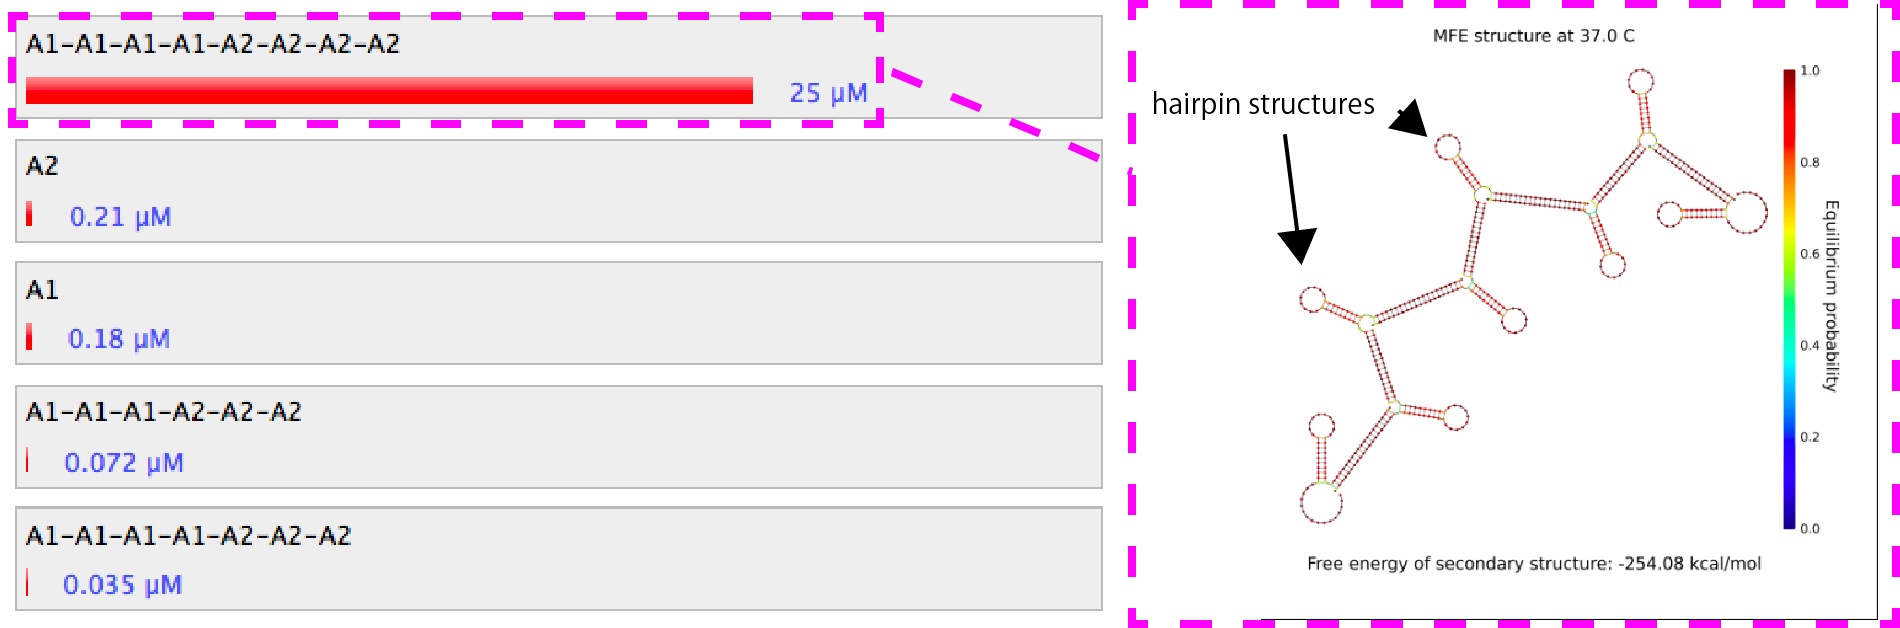
Figure 2. Similation results of the combination of A1 and A2.
link to nupack
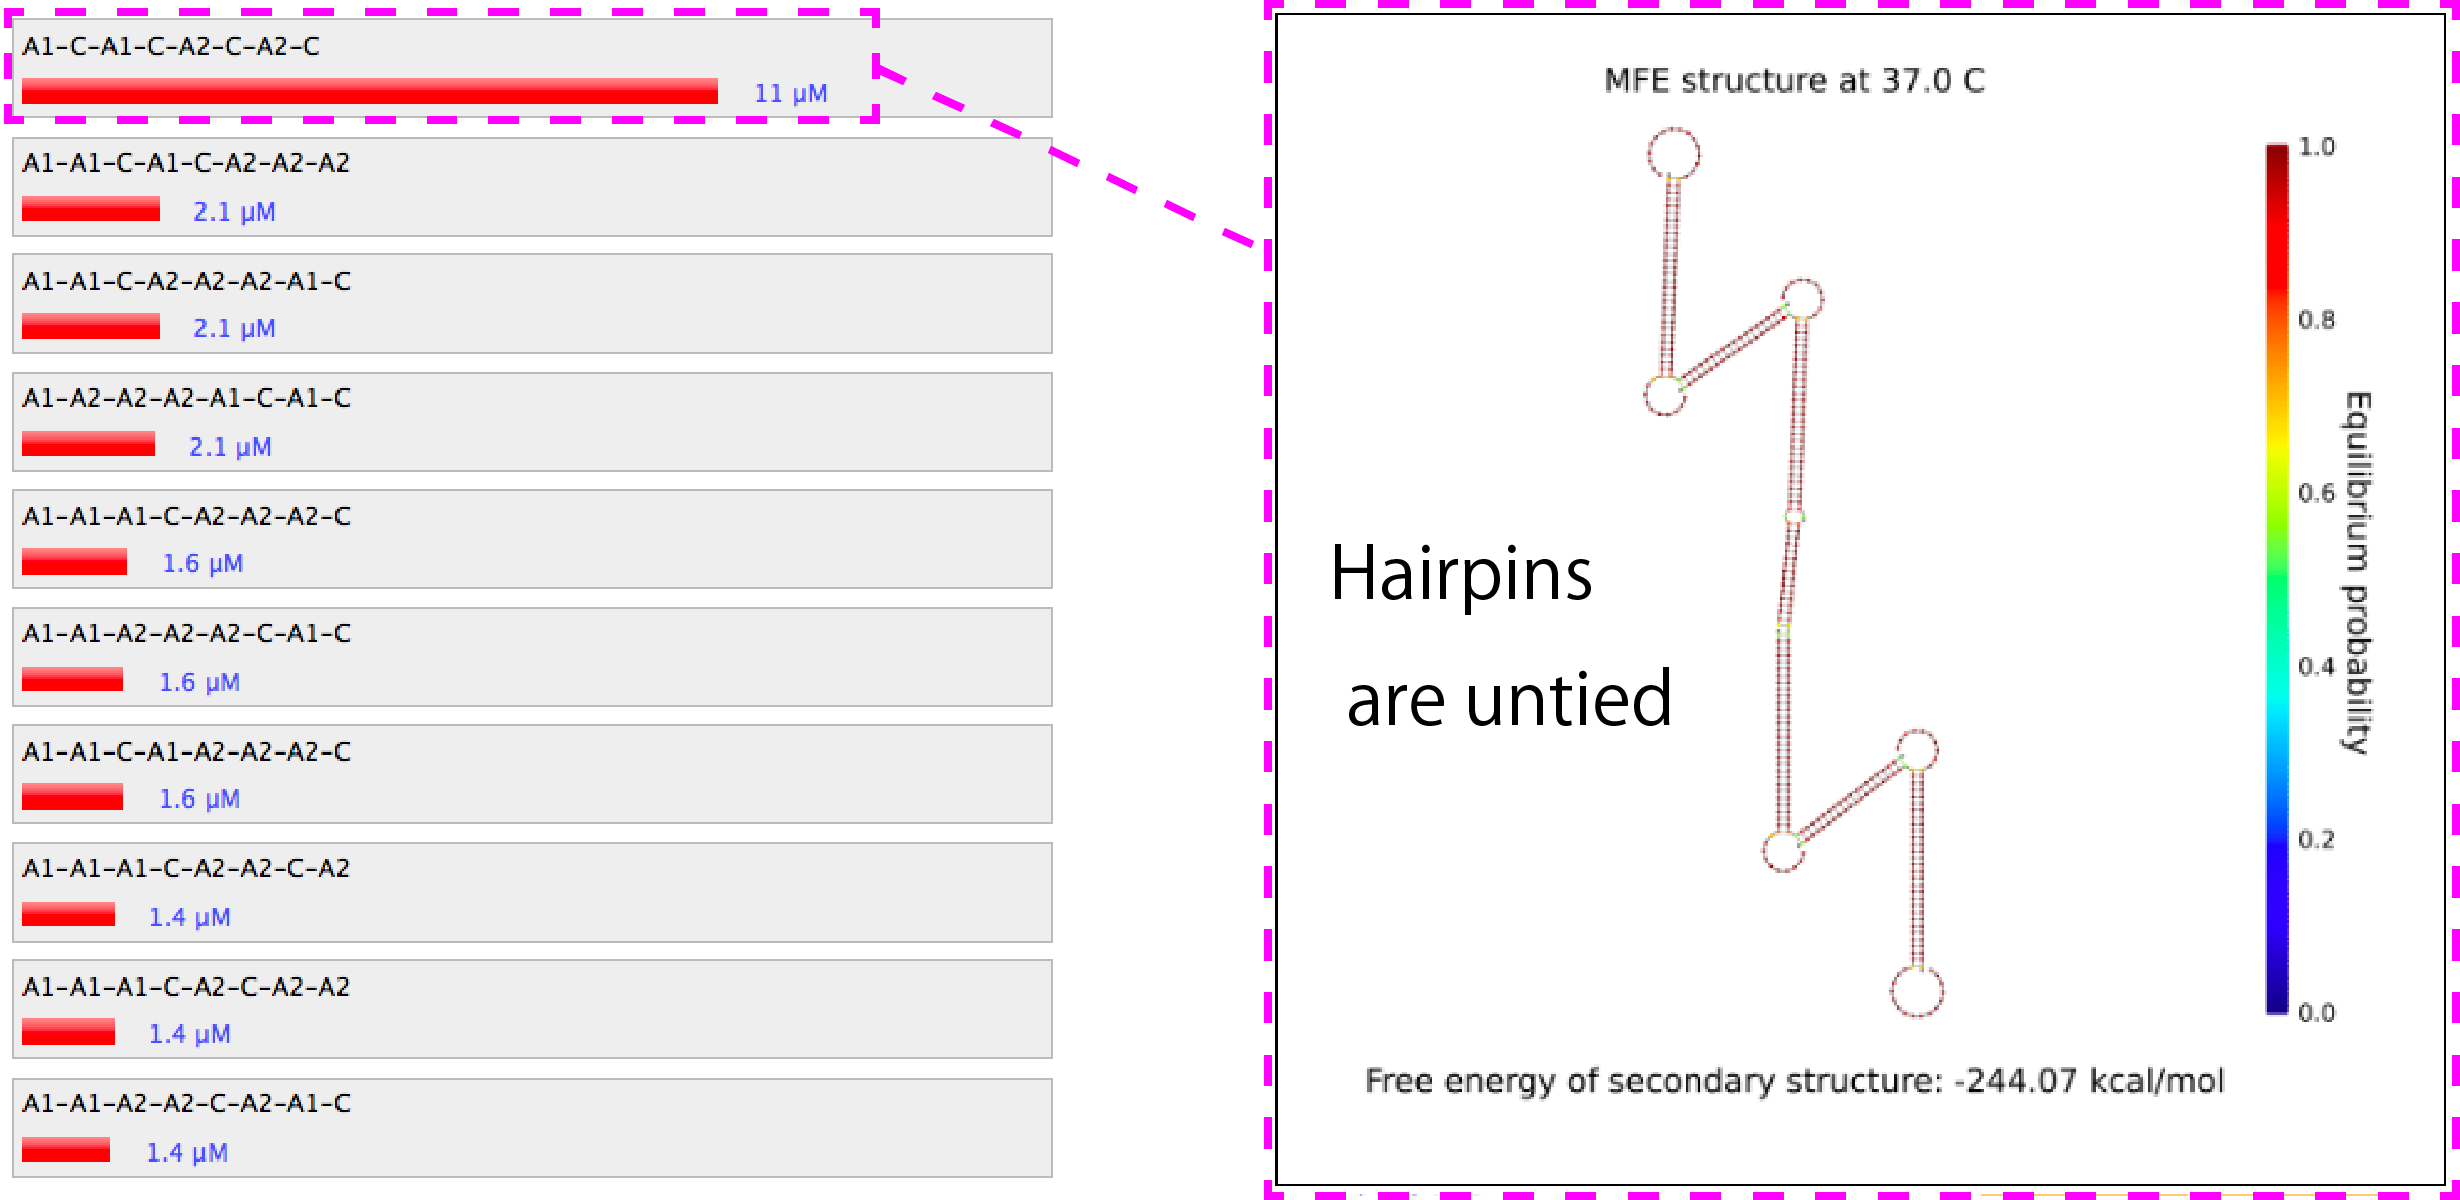
Figure 3. Similation results of the combination of A1, A2 and C.
link to nupack
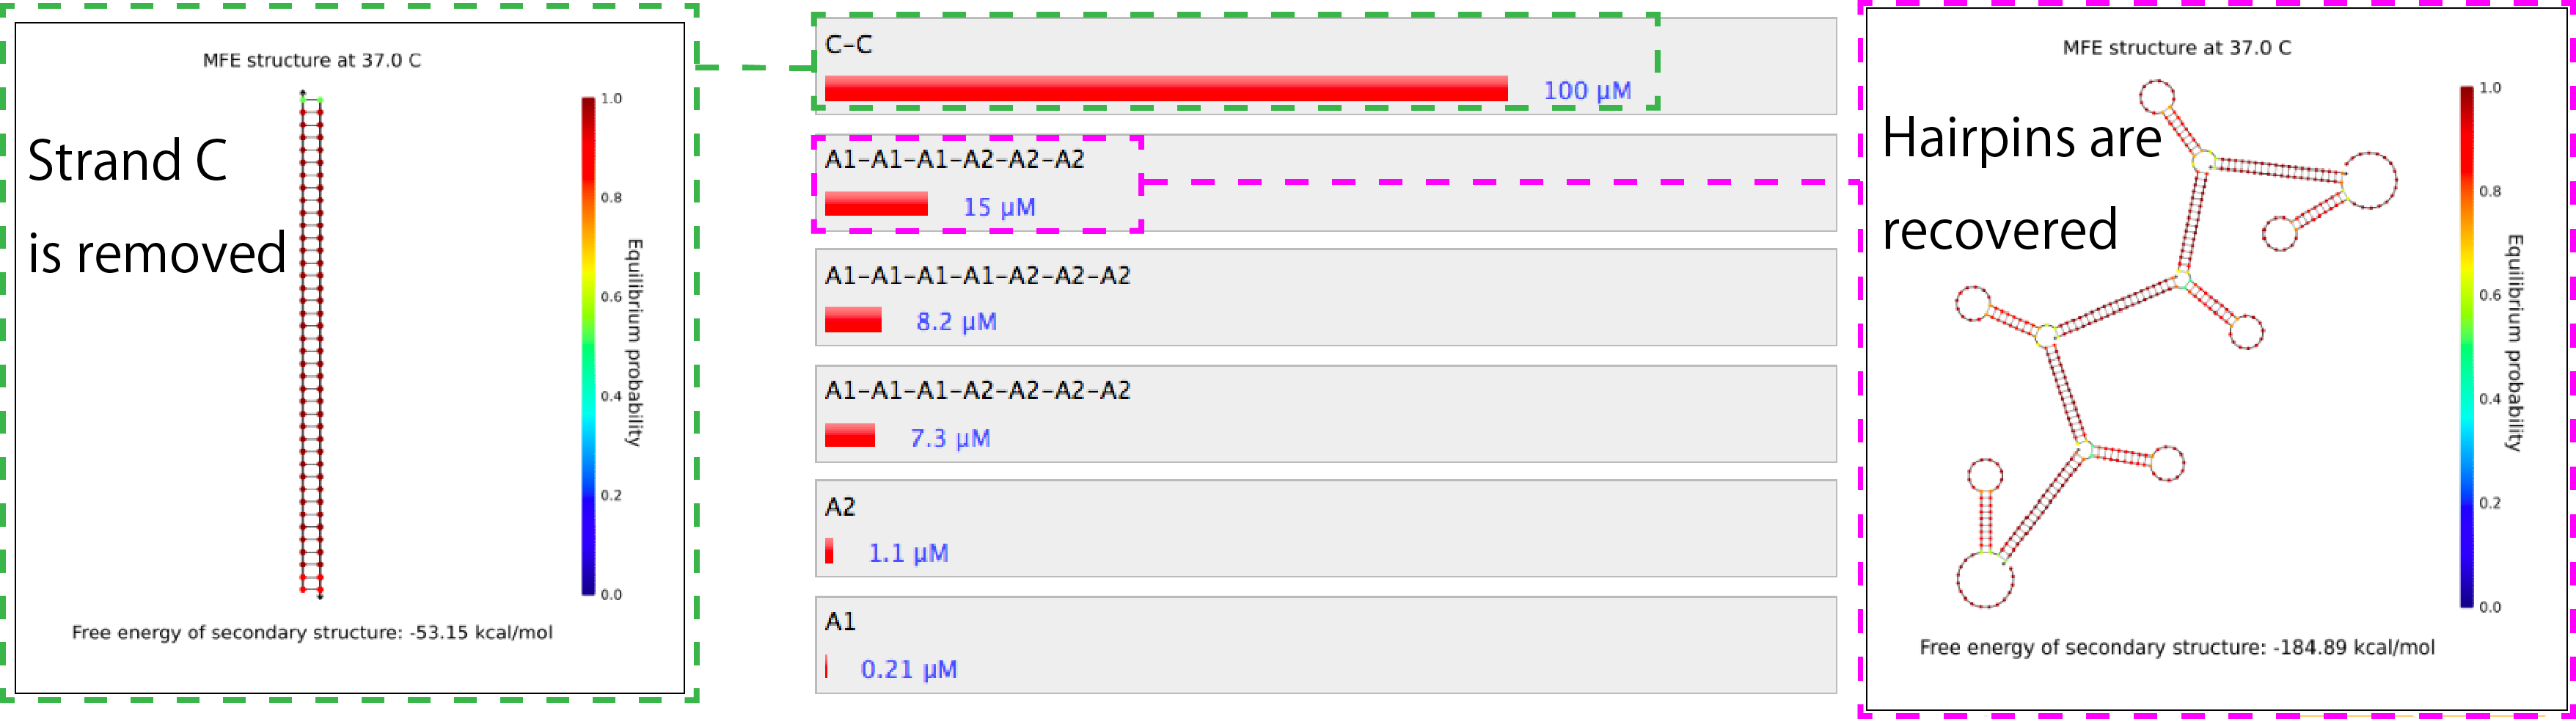
Figure 4. Similation results of the combination of A1, A2, C and C'.
link to nupack
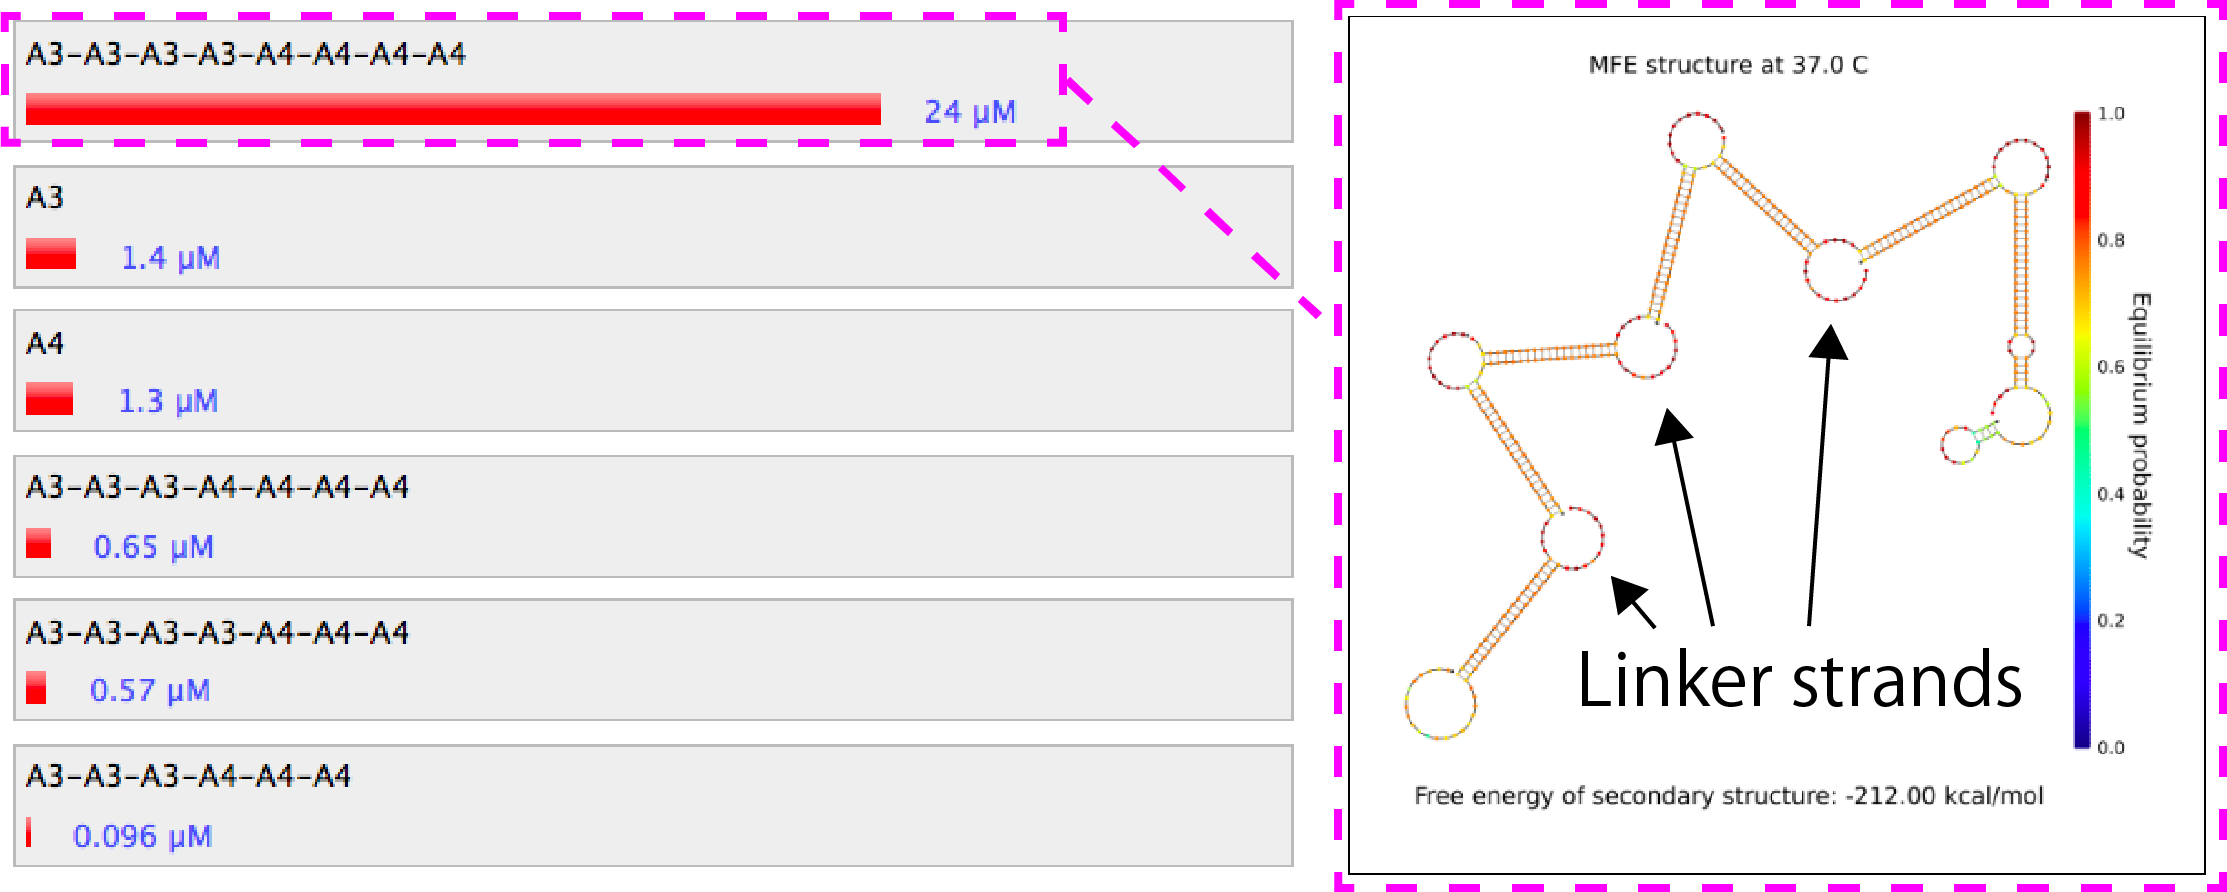
Figure 5. Similation results of the combination of A3 and A4.
link to nupack
The states of the combinations were estimated based on the result of agarose gel electrophoresis. The run time of electrophoresis was 2 hours.
| Sample index | 1 | 2 | 3 |
|---|---|---|---|
| TE(pH=8.0) | 7 | 8 | 8 |
| NaCl(1500mM) | 1 | 1 | 1 |
| I_H(10µM) | 1 | 0 | 1 |
| st1(10µM) | 1 | 1 | 0 |
| Loading Buffer | 2 | 2 | 2 |
| Total(µL) | 12 | 12 | 12 |
The states of the combinations were estimated based on the result of electrophoresis.
| Sample index | 1 | 2 | 3 | 4 | 5 | 6 | 7 |
|---|---|---|---|---|---|---|---|
| TE(pH=8.0) | 7.9 | 7.9 | 7.9 | 7.9 | 7.9 | 7.9 | 7.9 |
| NaCl(5M) | 0.3 | 0.3 | 0.3 | 0.3 | 0.3 | 0.3 | 0.3 |
| H1(10µM) | 0.6 | 0.6 | 0 | 0.6 | 0 | 0.6 | 0 |
| H2(10µM) | 0.6 | 0.6 | 0.6 | 0 | 0.6 | 0 | 0 |
| I_H(10µM) | 0.6 | 0 | 0.6 | 0.6 | 0 | 0 | 0.6 |
| Loading Buffer | 2 | 2 | 2 | 2 | 2 | 2 | 2 |
| Water | 0 | 0.6 | 0.6 | 0.6 | 1.2 | 1.2 | 1.2 |
| Total(µL) | 12 | 12 | 12 | 12 | 12 | 12 | 12 |
Based on the melting curve, the change of the ratio of double-strand was measured along the temperature fall, and the
effect of concentration of I_H on the formation of the gels was estimated. The DNA strands were first kept at 90℃ for 3 minutes and then the temperature was lowered to 20℃ by 1℃ per minute.
| Sample index | 1 | 2 | 3 | 4 | 5 |
|---|---|---|---|---|---|
| TE(pH=8.0) | 3.6 | 3.6 | 3.6 | 3.6 | 3.6 |
| H1(1mM) | 0.8 | 0.8 | 0.8 | 0.8 | 0.8 |
| H2(1mM) | 0.8 | 0.8 | 0.8 | 0.8 | 0.8 |
| NaCl(500mM) | 1.6 | 1.6 | 1.6 | 1.6 | 1.6 |
| EvaGreen | 0.4 | 0.4 | 0.4 | 0.4 | 0.4 |
| Beacon | 0.8 | 0.8 | 0.8 | 0.8 | 0.8 |
| I_H | 0 | 0.5 (100µM) | 1 (100µM) | 2 (100µM) | 0.5 (1mM) |
| Water | 2 | 1.5 | 1 | 0 | 1.5 |
| Total(µL) | 10 | 10 | 10 | 10 | 10 |
Based on the melting curve, the change of the ratio of double-strand was measured along the temperature fall, and the
effect of NaCl on the formation of the gels was estimated. This time, the DNA strands were kept at 95℃ for 10 minutes and then the temperature was lowered to 25℃ by 1℃ per 50 seconds.
| Sample index | 1 | 2 | 3 | 4 |
|---|---|---|---|---|
| TE(pH=8.0) | 4.5 | 4.5 | 4.5 | 4.5 |
| H1(1mM) | 1 | 1 | 1 | 1 |
| H2(1mM) | 1 | 1 | 1 | 1 |
| I_H(1mM) | 1 | 1 | 1 | 1 |
| EvaGreen | 0.5 | 0.5 | 0.5 | 0.5 |
| NaCl | 2 (125mM) | 2 (250mM) | 2 (500mM) | 2 (1000mM) |
| Total(µL) | 10 | 10 | 10 | 10 |
Based on the melting curve, the effect of the concentration of Mg2+ on the formation of the gels was estimated. The annealing procedure was as same as experiment 3.
| Sample index | 1 | 2 | 3 | 4 |
|---|---|---|---|---|
| TE(pH=8.0) | 4.5 | 4.5 | 4.5 | 4.5 |
| EvaGreen | 0.5 | 0.5 | 0.5 | 0.5 |
| H1(1mM) | 1 | 1 | 1 | 1 |
| H2(1mM) | 1 | 1 | 1 | 1 |
| I_H(100µM) | 1 | 1 | 1 | 1 |
| MgSO4(100mM) | 0 | 0.5 | 1 | 2 |
| Loading Buffer | 2 | 2 | 2 | 2 |
| Water | 2 | 1.5 | 1 | 0 |
| Total(µL) | 10 | 10 | 10 | 10 |