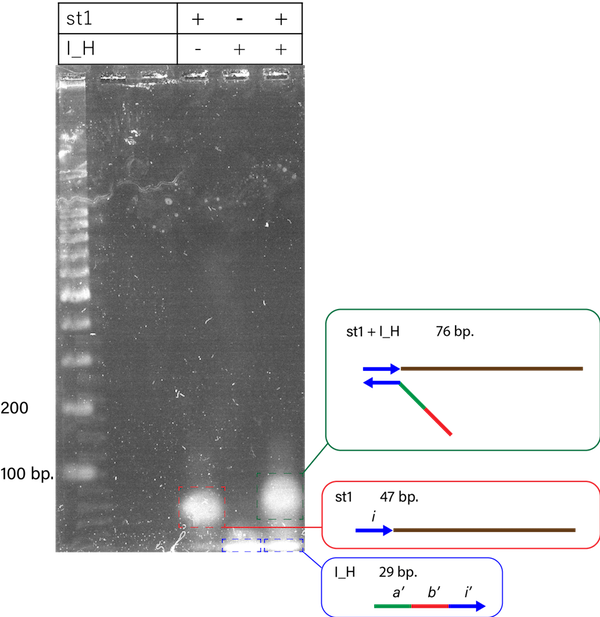
1. Electrophoresis of st1 and I_H
When st1 and I_H were mixed, we observed the third band. It is thought to be the dsDNA, resulted form hybridization
of st1 and I_H.
Figure 1. Electrophoresis image of
st1 and
I_H.
Link to an untouched image
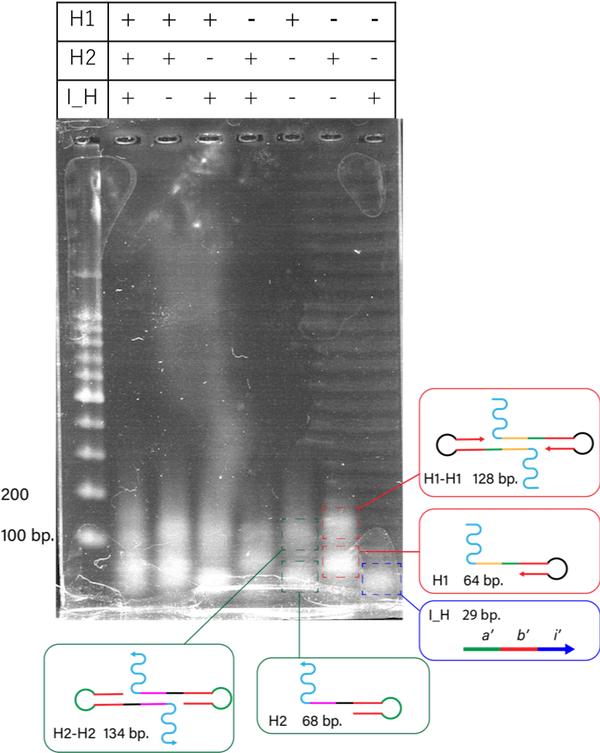
2. Electrophoresis of combination H1, H2 and I_H
H1 and H2 formed dimer, but any other hybridization was not seen.
Figure 2. Electrophoresis image of combination
H1,
H2 and
I_H.
Link to an untouched image
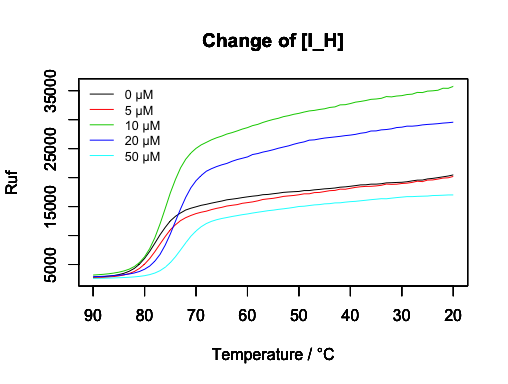
3. Melting curve with change of [I_H]
Hybridization reached peak when the ratio of [I_H]/[H1]([H2]) = 1/10.
Figure 3. Melting curve with change of [
I_H]
Link to csv data
[
H1], [
H2] = 100 µM
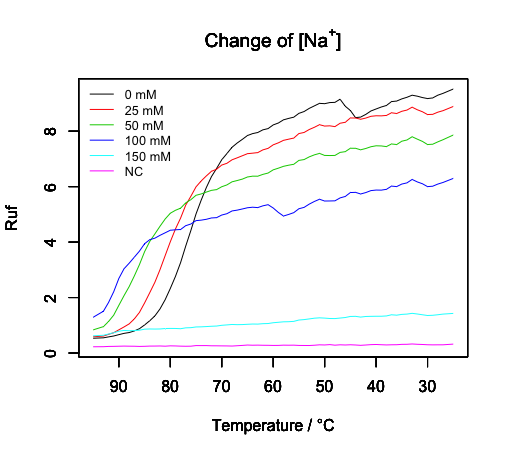
4. Melting curve with change of [Na+]
Sodium ion interfered hybridization.
Figure 4. Melting curve with change of [Na
+]
Link to csv data
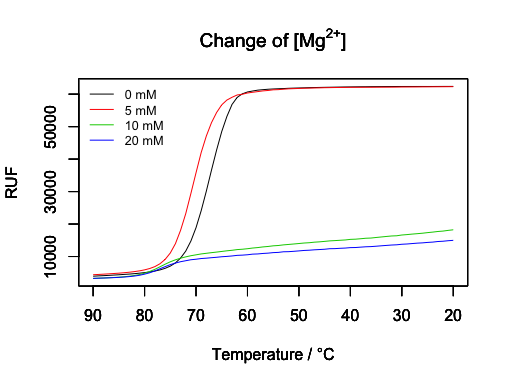
5. Melting curve with change of [Mg2+]
Magnesium ion interfered hybridization.
Figure 5. Melting curve with change of [Mg
2+]
Link to csv data